

As organizations move toward Kubernetes’ microservices to power their applications, performance under real traffic becomes the true test of architecture. This guide breaks down how to test, monitor, and validate scaling microservices, so your Kubernetes cluster stays reliable, efficient, and ready for production load.
However, scaling microservices is more than simply adding pods or increasing resources. Distributed systems introduce challenges such as inter-service latency, resource contention, database bottlenecks, and unpredictable traffic spikes that can quickly impact user experience.
By implementing a robust performance testing strategy, teams can identify bottlenecks early, validate autoscaling behavior, improve system resilience, and ensure applications continue to perform under peak demand. Whether you’re building cloud-native applications or modernizing existing systems, understanding how Kubernetes performs at scale is essential for delivering reliable, high-performing digital experiences.
Can Your Microservices Survive on a Scale?
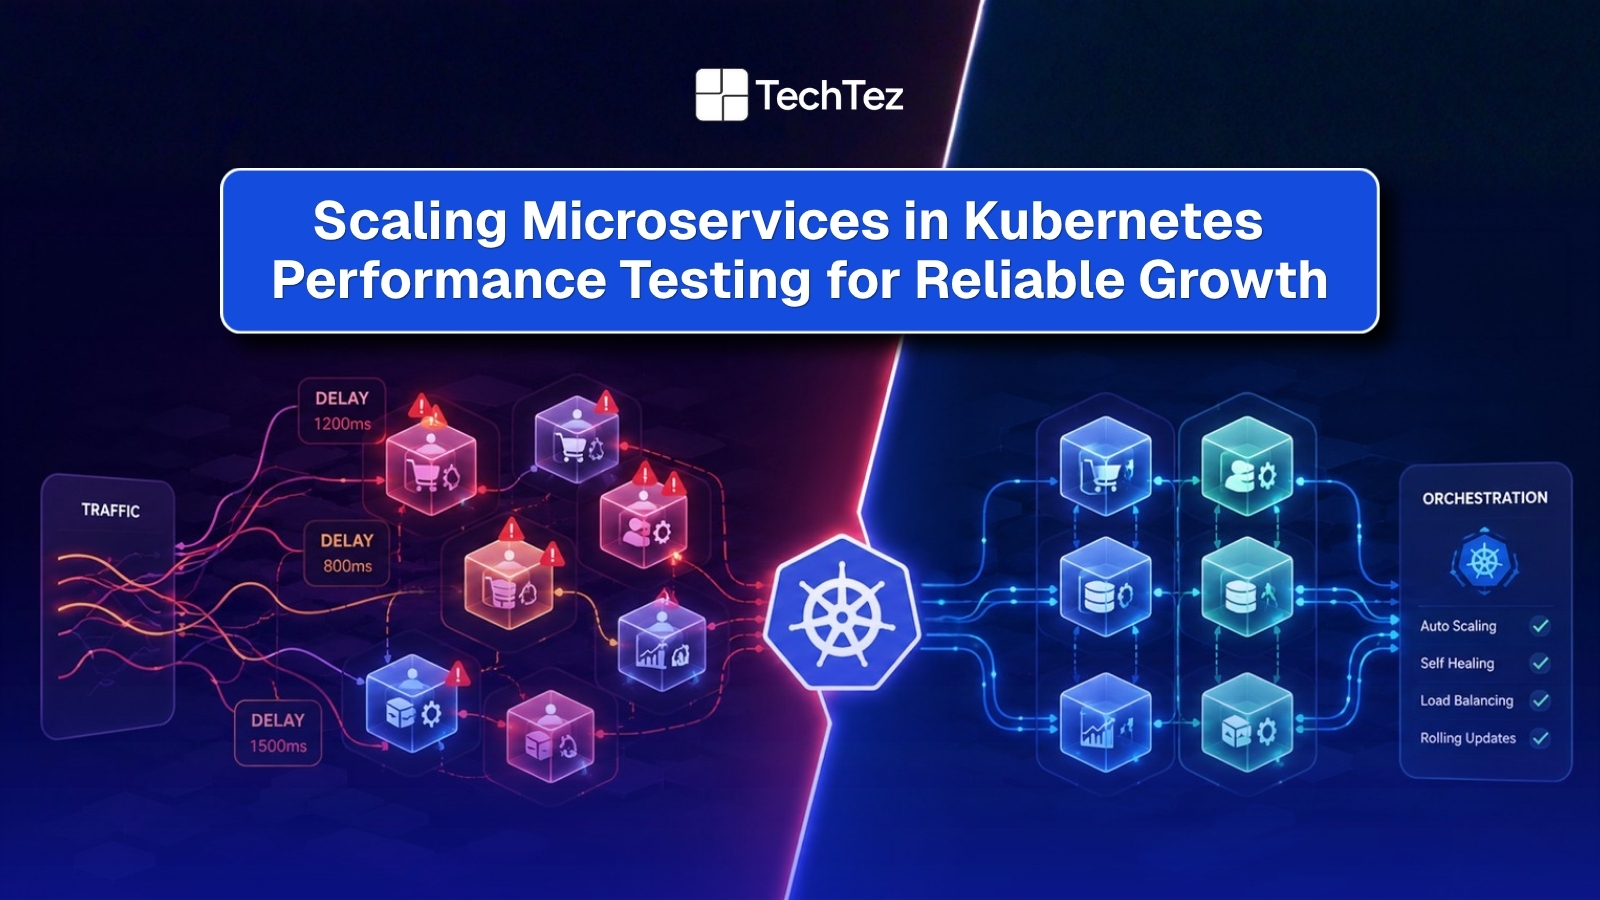
Microservices look great on paper for faster releases, flexible microservices architecture, and independent scaling. In the early stages, most applications built on microservices perform well. But things change when real traffic hits your Kubernetes environment.
Things start to shift the moment real traffic enters the system. It’s one thing to handle a few hundred requests. It’s another when thousands or even millions start hitting multiple services at the same time. That’s where the cracks begin to show. APIs that worked fine in isolation start slowing down. Dependencies pile up. Latency creeps in from places you didn’t expect. And suddenly, the system that felt scalable started behaving unpredictably.
This is where Kubernetes performance testing stops being optional. In most teams, the assumption is that Kubernetes will handle scale automatically. And to an extent, it does. But autoscaling, pod scheduling, service mesh layers, and shared infrastructure also introduce a level of complexity that isn’t always visible upfront. Without a structured testing approach, scaling becomes less about engineering and more about trial and error.
This is why building a strong cloud-native foundation becomes critical for long-term scalability and performance.
How Microservices Architecture Changes Performance
A microservice architecture behaves differently from traditional systems. In monolithic applications, everything runs together, so when performance drops, the issue is easier to find. In Kubernetes, containerized applications run as small, independent services across multiple pods in a cluster. These services constantly communicate with each other over the network, which increases complexity and makes managing microservices a much more demanding task than managing a single deployment.
Because each service can be deployed, scaled, and updated on its own schedule, performance is no longer a single number. It becomes a combination of how every service, container, and dependency behaves together under load, and how quickly the cluster can react when conditions change.
Common Performance Bottlenecks:
In a Kubernetes environment, performance issues rarely come from just one place. They often build across different parts of the system. Because everything is connected, even a small issue in one area can quickly impact multiple services across the system.
- Delays between services caused by too many API calls or an inefficient service mesh
- High CPU usage and memory usage due to poor resource allocation
- Database overload affecting multiple services at the same time
- Slow horizontal pod autoscaling during sudden traffic spikes
- Internal network traffic and latency within the cluster

The Ripple Effect in Distributed Systems
In distributed systems, issues rarely stay contained. A small slowdown in one service can quickly spread across the entire system. When a single service starts to struggle under increased traffic, the impact moves outward. For example, if an authentication or payment service becomes slow, every service that depends on it is forced to wait. This increases response times across the board.
As delays grow, systems often trigger retries to recover failed requests. While retries are meant to help, they can also increase traffic and put even more pressure on already stressed services. This creates a chain reaction: more requests lead to higher CPU usage and memory usage; queues begin to build, network traffic increases, and other services that were initially stable may also start to slow down. Over time, this can turn into a system-wide slowdown or even partial outages. What makes this challenging is that the root cause is always the issue may start in one service but show symptoms in another.
This is why fault tolerance and high availability are essential. Systems must be designed to handle failures gracefully, isolate issues, and recover quickly without affecting the entire application. Patterns like blue-green deployments and rolling updates also help reduce risk during deployment by allowing traffic management between old and new versions of a service.
Why Observability Matters?
In Kubernetes, the system is always changing. Pods are created, replaced, or scaled up and down to maintain the desired state. At the same time, traffic flows through load balancers, ingress controllers, and sometimes a service mesh before reaching your services. Because of this dynamic nature, it’s not enough to just run tests; you need to understand what’s happening inside the system while those tests run.
Without proper observability, you’re essentially operating in the dark. You might see that response times are increasing, but you won’t know why. Is it CPU usage on a specific pod? Is network latency between services? Or is autoscaling reacting too slowly?
Observability connects these dots. By combining metrics, logs, and distributed tracing, teams can track how requests move across services, identify bottlenecks, and understand how different parts of the system interact under load.
Tools like Prometheus and Grafana are widely used for monitoring Kubernetes environments, helping teams track performance in real time. This becomes even more important in microservice environments, where issues don’t stay isolated. A small delay in one service can impact many others, and without visibility, it’s hard to trace the root cause back to where it started.
In short, observability turns performance testing from guesswork into insight. This becomes critical when building DevOps-driven cloud systems that requires continuous monitoring, automation, and performance optimization.
Key Performance Testing Strategies
A strong strategy for managing microservices requires more than just one type of test. Different scenarios reveal different weaknesses, so combining approaches gives a clearer picture of how the system behaves in real conditions.
1. Isolated Service Testing: Start by testing individual services before full deployment. This helps you understand how each service performs on its own with its response time, resource usage, and dependency behavior. Fixing issues at this stage is faster and prevents them from spreading across the system later.
2. Load Testing: Load testing simulates real user traffic to evaluate how your system performs under expected conditions. According to Google Cloud best practices, performance testing should closely mirror real production workloads to ensure accurate system behavior under load This becomes especially important when working with distributed microservices architectures, where performance validation across multiple services is critical for stability in production environments.
3. Stress Testing: Stress testing pushes the system beyond its normal limits. It helps identify breaking points and shows how your system behaves under extreme pressure. This is important for validating horizontal scaling and understanding how failures begin.
4. Soak Testing: Some issues don’t appear immediately. Soak testing runs the system for an extended period to uncover memory leaks, increasing memory usage, or gradual performance drops. This ensures long-term stability, not just short bursts of performance.
5. Chaos Engineering: Chaos engineering introduces controlled failures, such as stopping pods or simulating network issues. This helps test how well your system recovers and maintains stability. It strengthens fault tolerance and prepares your system for real-world failures.
6. Autoscaling Validation: Autoscaling needs to be tested, not assumed. Validate how the horizontal pod auto scaler and cluster autoscope respond under load.
Insight: Check
- How quickly pod replicas are created when traffic increases
- Whether scaling decisions are based on the right custom metrics
- If resource utilization remains balanced and efficient
Implementing a Performance Testing Workflow
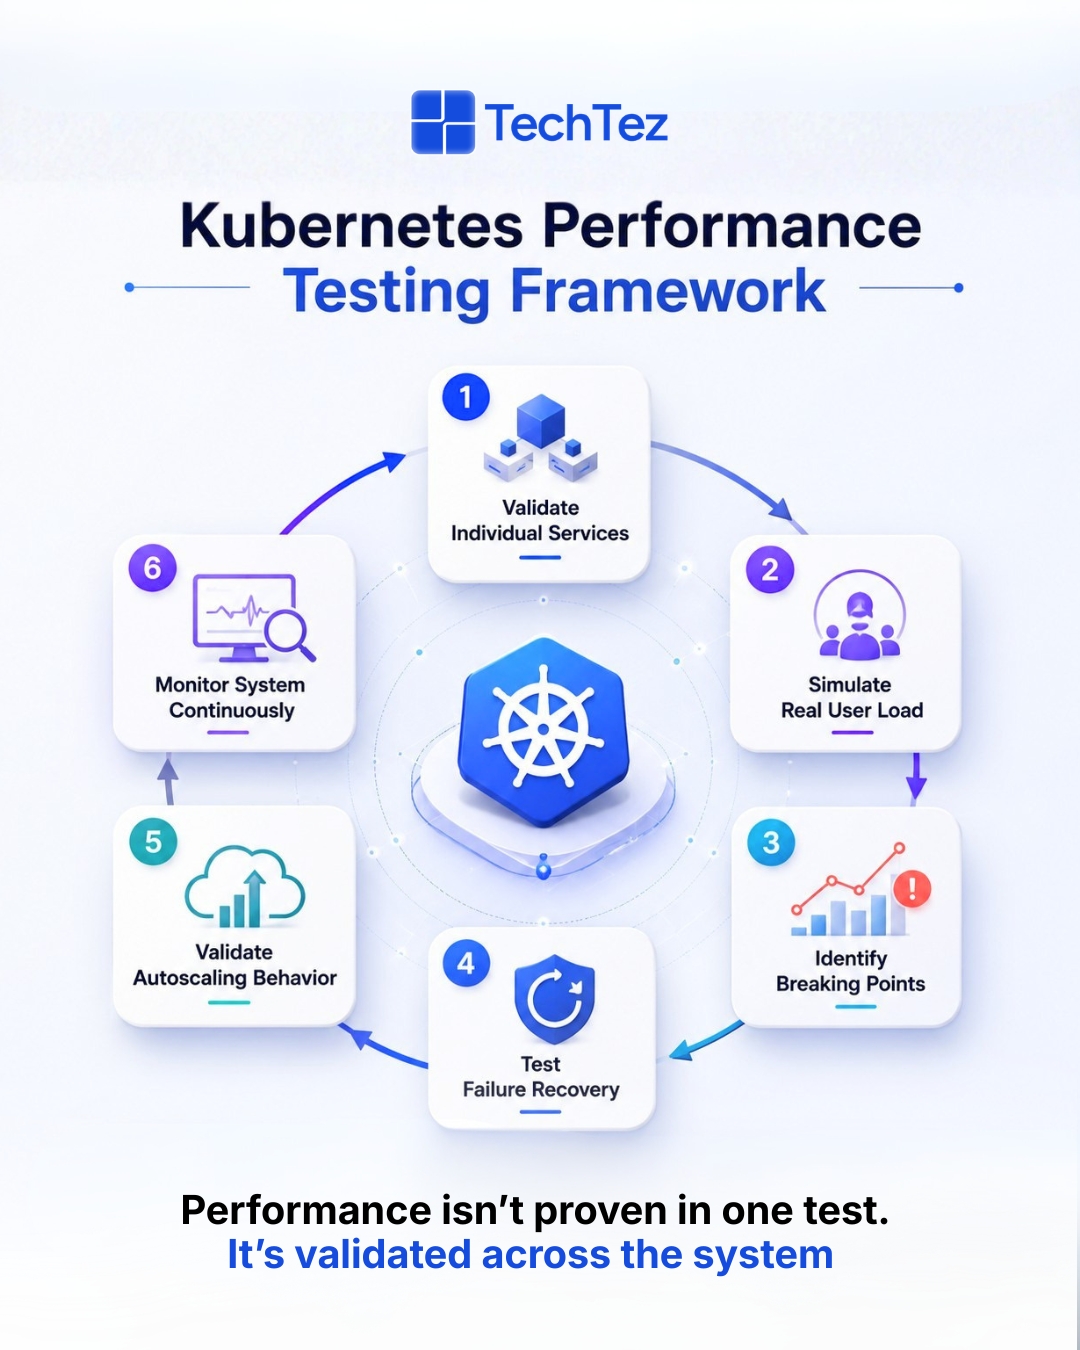
Step 1: Test Individual Microservices Start by validating each service independently before it’s part of a larger flow. Make sure it handles requests efficiently, manages resources properly, and works well with its dependencies such as databases, caches, or third-party APIs before integrating it into the system. Testing in isolation also makes it easier to set up a performance baseline, so any regression after integration is easy to spot.
Step 2: Simulate Real User Behavior Use realistic user actions such as login, search, browsing, and transactions, rather than generic or randomized requests. This gives a more accurate view of how your application behaves compared to synthetic traffic patterns. Realistic scenarios should also reflect peak usage times and common user journeys, since real traffic rarely arrives evenly.
Step 3: Validate Scaling Behavior Observe how the system reacts as traffic increases gradually rather than all at once. Monitor how pods are created, how load is distributed across services, and how resources are allocated across the Kubernetes cluster. Pay attention to how quickly scaling kicks in and whether it actually improves response times or just adds capacity without benefit.
Step 4: Test Failure Scenarios Introduce controlled failures such as pod crashes, dependency timeouts, or network issues to evaluate how the system recovers. This helps ensure high availability and confirms that issues in one service don’t bring down the entire system, especially when multiple things go wrong at once.
Step 5: Enable Continuous Monitoring Performance testing doesn’t stop after execution it continues into production. Continuous monitoring helps track system health over time and detect issues early, often before users notice.
Insight: Tools like Prometheus and Grafana help monitor: CPU utilization, Memory usage Network traffic and Overall resource utilization
Key Metrics to Monitor During Kubernetes Performance Testing
Response Time:Measure latency using percentiles like P95 and P99, not just averages. Average response time can hide spikes, while percentiles show how your system behaves for most users under peak conditions. If P95 or P99 is high, it usually means some users are experiencing slow responses even if the average looks fine.
Throughput: Track how many requests your system can handle per second. This helps you understand the true capacity of your application under load. Monitoring throughput alongside response time is important if throughput increases, but response time also rises sharply; it may indicate the system is reaching its limits.
Error Rate: Monitor failed or timed-out requests during testing. A sudden increase in errors often signals system stress, misconfiguration, or resource exhaustion. Keeping an eye on error patterns also helps identify whether issues are isolated or affecting multiple services.
Resource Utilization Track: CPU usage, memory, and overall Kubernetes resources across pods and nodes. High utilization may indicate bottlenecks, while consistently low utilization can point to inefficient resource allocation. Balanced usage is key for both performance and cost control.
Network Latency :Measure delays in communication between services. In microservices environments, even small delays can add up as requests move across multiple services. High latency may indicate network bottlenecks, misconfigured routing, or excessive service dependencies.
Queue Length :If your system uses queues, monitor how they grow over time. Increasing queue length usually means incoming requests are faster than processing capacity. If not addressed early, this can lead to delays, timeouts, and poor user experience.
Together, these metrics provide a clear, real-world view of how your system performs under load and where improvements are needed.
Key Takeaways
Scaling microservices in Kubernetes improves flexibility and speed, but performance doesn’t come automatically. It requires structured testing, continuous monitoring, and strong observability to understand how Kubernetes microservices behave under real conditions. When teams combine load testing, stress testing, and chaos engineering, they move from reacting to issues to preventing them. Following these best practices early in deployment also makes managing microservices easier as the system grows. Because in modern systems, performance isn’t something you fix later; it’s something you build from the start.