

Most API failures don’t look like failures at first.
Endpoints return 200 Schemas that are validated and which passes Authentication. Teams sign off on testing, releases go out, and everything looks fine until traffic spikes, a downstream service slows down, or a concurrent workload reveals a latency problem with no unit test ever touched.
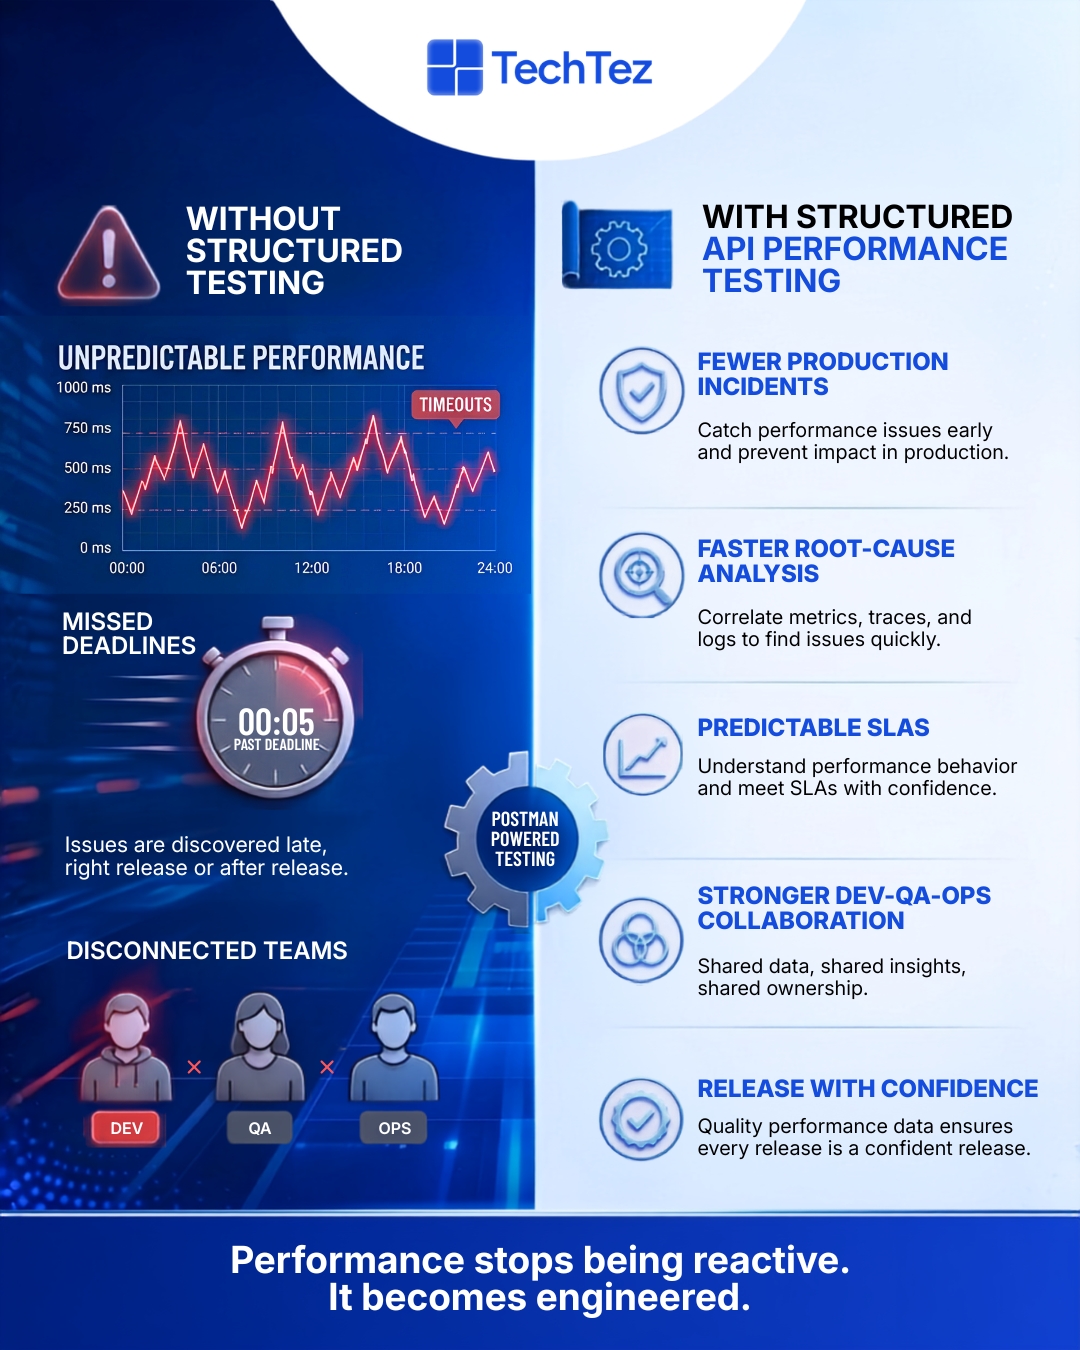
The issue with functional testing is that it answers one narrow question: Does the API work? What it leaves unanswered is everything that determines whether an API holds up in the real world. APIs break because they work too slowly, too inconsistent, or under load conditions that were never part of the test plan. The gap between a passing test suite and a production-ready API is where performance testing lives and it is a gap that costs engineering teams significant time, credibility, and customer trust when left unaddressed.
This blog walks through 5 best practices for API performance testing with Postman, helping teams move from basic checks to production-grade confidence.
Why Performance testing is the missing layer in most API Strategies:
Functional testing has a clear success condition: the endpoint behaves as specified. Performance testing operates in a different space entirely, one where the success condition is reliable under conditions that are unpredictable, variable, and often adversarial. In distributed, microservices-driven architectures, a single slow API creates a chain reaction. Latency compounds across service calls, SLA thresholds erode, and user-facing degradation follows quickly.
AI agents, mobile applications, and third-party integrations amplify this unpredictability because they generate traffic patterns that no development environment can fully anticipate. Performance issues rarely surface during development because development environments are controlled. They appear when traffic grows faster than expected, when multiple services interact under real concurrency, or when a downstream dependency responds at half its normal speed during a peak window. By the time these issues surface in production, the cost of resolution is significantly higher than it would have been at the testing stage.
The engineering team will go under pressure, the incident will be live, and the root cause is buried under layers of service interaction that were never tested together. The teams that avoid this pattern treat performance testing as a structured, continuous discipline rather than a pre-release formality. They test workflows, measure what users actually experience, and automate performance checks so that regressions surface in CI/CD before they reach customers.
What Postman brings to API Performance Testing
Postman is the tool most engineering teams already have, already trust, and already use daily for API development and functional validation. Its performance testing capabilities extend well beyond what most teams actively apply. Postman supports lightweight performance and regression testing using collections, scripts, and runners, as detailed in the official Postman Collection Runner and test scripting documentation without requiring a separate toolchain or a dedicated performance engineering role.
The value postman delivers in performance testing comes from its proximity to the development workflow. It catches regressions early, validates performance behaviour across realistic functional flows under moderate load, and integrates directly into the same collections teams use for functional testing, lowering the barrier to consistent performance coverage significantly.
When performance requirements grow in scale, high-concurrency soak testing, spike testing, protocol-level simulation dedicated tools like k6, JMeter, or Gatling take over. Those scenarios require an established performance baseline to be worth stress-testing, and Postman is where that foundation gets built.
The two approaches are complementary, and teams that apply both consistently are the ones whose APIs hold up when production traffic stops behaving predictably.
5 Best Practices for API Performance Testing with Postman:
Performance problems are predictable when teams have the right practices in place and Postman, applied with the right strategy, is the tool most teams already have to start catching them early.
The five practices below cover how to structure tests, what to measure, how to introduce the variability that surfaces real bottlenecks, where to automate, and how to connect performance data to the observability that makes root-cause analysis fast. Together, they move API performance testing from a pre-release checkpoint into a continuous engineering discipline that produces reliable, production-grade APIs across every release cycle.
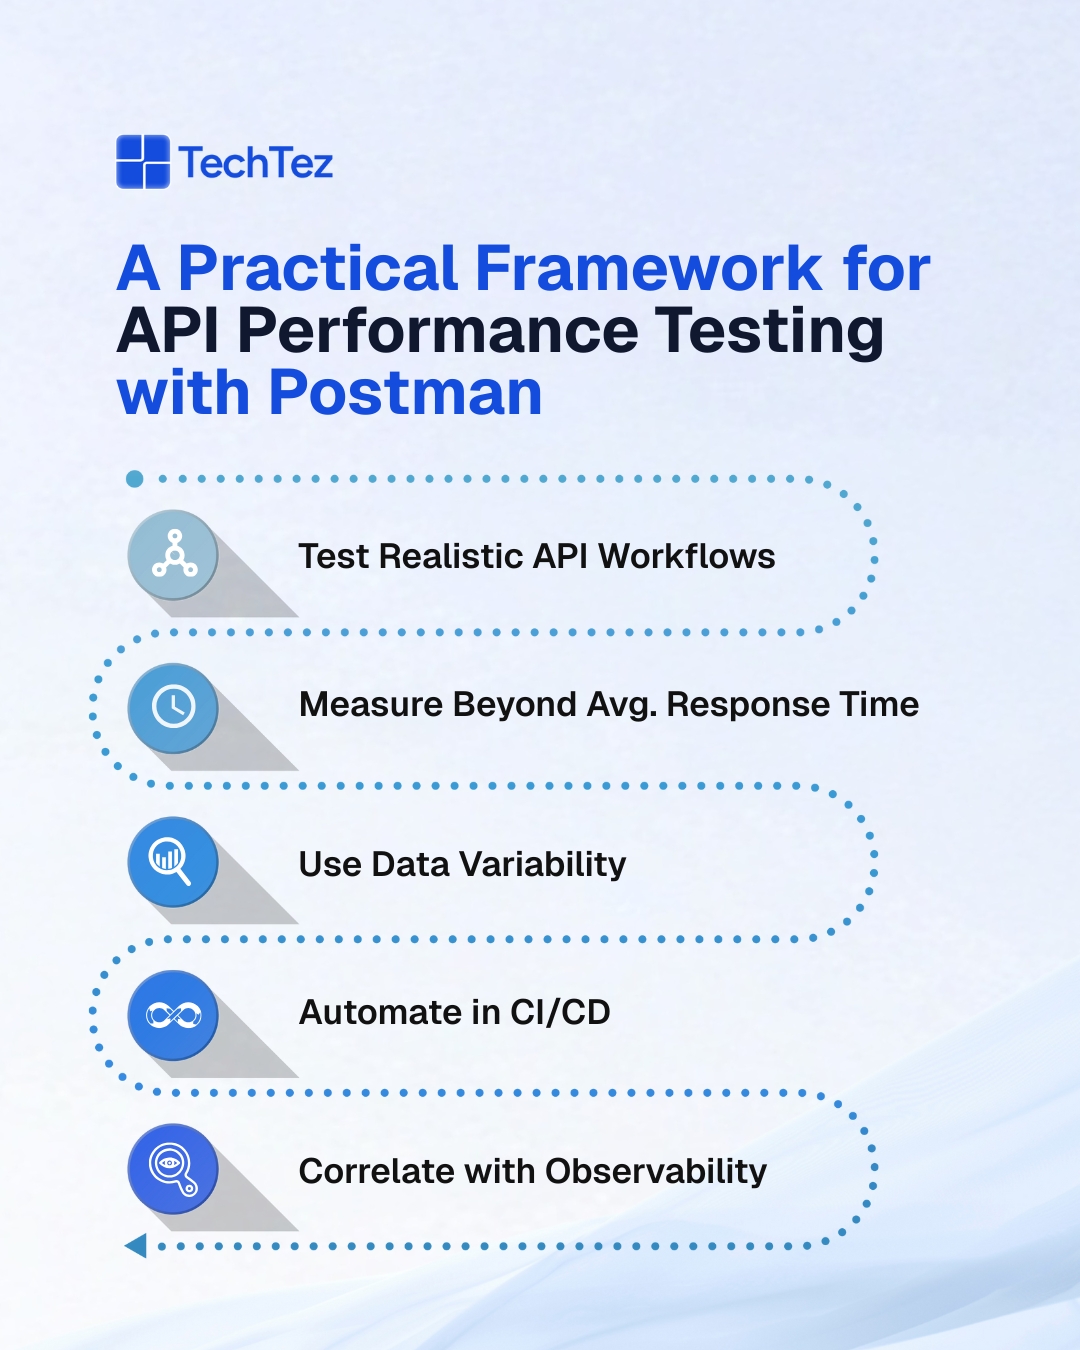
1. Test Realistic Workflows instead of isolated Endpoints
The single most consequential shift a team can make in API performance testing is moving from endpoint-level checks to workflow-level simulation. APIs are designed to be consumed in sequence:
- A telecom platform authenticates a user, retrieves their account profile, queries service eligibility, and processes a transaction – all within a single customer interaction.
- A healthcare system authenticates a clinician, fetches a patient record, queries lab results, and submits an update, often through four or more distinct API calls chained together.
Testing any one of those calls independently tells a team very little about how the system performs when all of them run in sequence under real conditions. Authentication of overhead accumulates; Session tokens get passed and validated across calls. Downstream services introduce latency that compounds with each additional hop. An API endpoint that responds in 90ms in isolation can become a 600ms bottleneck when placed inside a realistic workflow.
Building Postman collections that model complete workflows exposes end-to-end latency that isolated endpoint testing will never reveal and that is the performance picture that actually matters in production.
To build workflow-level performance tests in Postman that reflect real usage conditions, teams should focus on:
- Chaining requests using environment variables: Pass tokens, resource IDs, and session data dynamically between calls so each request in the collection mirrors how a real client consumes the API
- Modelling complete user or system journeys: Structure collections around full interaction flows rather than individual endpoints, covering authentication through final data submission
- Including all dependent service calls: Incorporate every API call that participates in a workflow, including authentication, profile retrieval, and downstream triggers, so accumulated latency is captured accurately
- Validating workflow-level response time thresholds: Set assertions at the collection level that reflect end-to-end SLA expectations, not individual endpoint benchmarks
2. Measure the metrics that reflect what users actually Experience
Average response time is the most reported performance metric and the one that provides the least useful signal for production readiness. Averages absorb outliers and outliers are exactly what users experience at scale.
A system that returns 95% of responses in under 200ms but returns 5% in over 3 seconds will average somewhere around 350ms, a number that sounds acceptable and conceals a serious user experience problem. The users in that 5% percentile are the ones filing support tickets, abandoning transactions, and forming opinions about system reliability.
The specific metrics worth capturing and asserting on in Postman test scripts include:
- P95 and P99 response times tail latency metrics that reflect what the slowest users actually experience, rather than the average that smooths over their reality
- Error rates under sustained execution tracks 4xx and 5xx response rates across repeated runs reveals whether the system degrades as call volume accumulates
- Time distribution across authentication versus business logic identifies where in the request cycle latency originates determines which layer to optimize
- Payload size versus response time correlation tests across varying request sizes reveals whether serialization and processing performance scales acceptably or breaks at specific thresholds
- SLA threshold assertions in test scripts hardcoding are acceptable with a response time that limits as assertions means builds fail automatically when a release candidate introduces a regression
3. Introduce Data variability to surface the Bottlenecks that hide in plain sight
Testing the same request with the same payload repeatedly produces a false picture of system performance. It tells a team how the API performs under one specific, predictable input condition, which is rarely the condition that triggers problems in production.
Real systems handle variability constantly: users with different roles and permission scopes, requests with payloads that range from minimal to substantial, queries that touch well-indexed paths and queries that hit cold database paths that have never been optimized. The bottlenecks that surface under variability are the ones that generate incidents. APIs behave differently when payload sizes grow, when queries activate different database execution plans, or when caching logic is bypassed because an edge-case input falls outside cached parameter.
Practical ways to introduce meaningful data variability into Postman performance tests include:
- CSV and JSON data files in Collection Runner define multiple input scenarios in a data file and execute the collection across all of them in a single run, covering the range of conditions the API encounters in production
- Randomized inputs via pre-request scripts generate dynamic values for user IDs, payload sizes, and parameter combinations so each execution explores a different code path rather than repeating the same one
- Multiple authorization scopes and user roles test across different permission levels to reveal whether authorization logic adds variable overhead depending on the role being processed
- Small and large payload combinations alternating between minimal and maximum-size request bodies exposes whether the API’s serialization and processing performance scales predictably or degrades sharply past a threshold
- Edge-case inputs alongside standard ones inputs that fall outside typical ranges often activate code paths and database queries that are slower or more resource-intensive than those exercised by standard test data
4. Integrate Performance checks directly into CI/CD Pipelines
Performance testing confined to a manual, pre-release activity will always lose ground to the pace of development. APIs degrade gradually and incrementally across release cycles. A feature addition introduces a new validation step that costs 15ms. An upstream dependency update changes serialization behavior and adds another 20ms. A schema change introduces a database join that costs 30ms at low concurrency and 200ms under load. None of these changes individually cross a threshold that triggers attention, but their cumulative effect over several releases produces an API that performs measurably worse than it did six months prior and no single commit explains why.
Building effective CI/CD performance gates with Newman and Postman involves several concrete steps:
- Execute collections via Newman on every build or release candidate integrate Newman commands directly into the CI/CD pipeline so performance checks run automatically alongside unit tests and integration tests
- Define response time thresholds as hard build gates configure Newman to fail the build when response times exceed defined SLA thresholds, making performance a first-class quality criterion with real enforcement
- Track performance trends across releases store test results over time and chart response time trends by release so incremental regressions become visible before they compound into a serious problem
- Scope checks to high-risk workflows prioritize performance gates on the API workflows that carry the highest traffic or are most sensitive to latency, ensuring the most impactful paths are validated on every deployment
- Align thresholds with production SLA commitments base performance gates on the actual response time targets the organization has committed to, so CI/CD enforcement reflects real operational requirements rather than arbitrary limits
5. Pair Performance Data with System Observability for Precise Root-Cause Analysis
A slow API response identifies a symptom. The cause lives somewhere inside the system in a database query plan, a downstream service’s response time, a memory allocation pattern under concurrency, or a network hop that adds latency only under specific load conditions.
Performance testing without observability produces reliable symptom reports that still leave teams guessing what to fix. The combination of performance testing and observability is what makes diagnosis precise and resolution fast. When a response time spike appears in Postman test results, distributed traces show exactly which service call in the chain is responsible. CPU and memory metrics during test execution reveal whether the bottleneck is compute-bound or resource-constrained.
Implementing meaningful observability correlation alongside Postman performance testing requires attention to several areas:
- Distributed tracing during test execution run tests with tracing enabled so each Postman request generates a trace that shows exactly which downstream service call is responsible for elevated response times
- Infrastructure metrics correlated by time window capture CPU, memory, and connection pool metrics during test runs so resource constraints can be identified and attributed to specific API workflows
- Database query performance monitoring correlate slow API responses with database query execution plans and timings to identify the specific queries that underperform under the load patterns tests generate
- Downstream service latency tracking measure the response times of every external dependency called during a workflow test so performance degradation can be attributed to the correct service rather than the application being tested
- Log correlation by request ID instrument APIs to propagate a consistent request identifier through logs and traces so Postman test results can be matched to precise log entries for detailed root-cause investigation
The Mistakes that limit the value of Postman Performance Testing:
Teams that adopt performance testing without a clear methodology tend to converge on the same set of patterns that limit what they get from the investment. These patterns are worth recognizing early, because they are the difference between performance testing that produces actionable results and performance testing that produces a false sense of confidence.
Recognizing these patterns early and building the five practices in this blog specifically to address them is what determines whether a team’s performance testing program produces reliable results or just the appearance of coverage.
The most common mistakes to address when building a Postman performance testing program include:
- Testing endpoints in isolation rather than complete workflows: Individual endpoint performance does not represent production behavior; workflow-level testing is required to surface the latency that accumulates across service interactions
- Using identical payloads across all test runs: Static test data bypasses the variability that triggers real bottlenecks; data-driven testing with diverse inputs is required to find them
- Relying on average response time as the primary metric: Averages conceal tail latency; P95 and P99 metrics, error rates, and SLA threshold assertions provide the signal that matters
- Running performance tests manually before releases: Manual testing allows incremental regressions to accumulate invisibly; automated CI/CD integration is required to catch them at the point of introduction
- Treating Postman as the complete performance testing solution at all scales: Postman excels at early validation and regression detection; high-concurrency and stress testing scenarios require dedicated tools to produce accurate, reliable results
When Performance Requirements Call for More Than Postman:
Postman delivers high value for early-stage performance validation, regression detection across releases, and API contract and behavior checks under moderate load conditions. As performance requirements grow in complexity and scale, dedicated tooling becomes necessary to produce accurate results. High-concurrency scenarios involving thousands of simultaneous users, soak testing that runs for extended periods to detect memory leaks and resource exhaustion, spike testing that simulates sudden traffic surges, and protocol-level simulation for streaming or TCP-based APIs all require tools like k6, JMeter, or Gatling.
At TechTez, Postman and enterprise-grade performance tools are applied together across engagements, Postman establishing the performance baseline and catching regressions early, and specialized tools providing the depth and scale that production resilience validation demands. The two approaches reinforce each other, and the teams that apply both consistently are the ones whose APIs hold up when production traffic stops behaving predictably.
For high-concurrency, stress, and soak testing scenarios, teams should complement Postman with dedicated API load testing tools like k6 to gain deeper resilience insights.
How TechTez helps teams scale API Performance Testing:
TechTez partners with enterprises to:
- Design API testing strategies aligned with architecture
- Integrate Postman and Newman into CI/CD pipelines
- Combine functional, performance, and observability practices
- Scale testing using advanced tools when needed
Our goal is simple: APIs that work, perform, and scale without surprises.
APIs rarely fail because they don’t work. They fail because they work too slowly, too inconsistently, or under unexpected load. Postman, when used thoughtfully, helps teams detect these issues early.
The best time to test API performance was before production. The second-best time is before your next release.